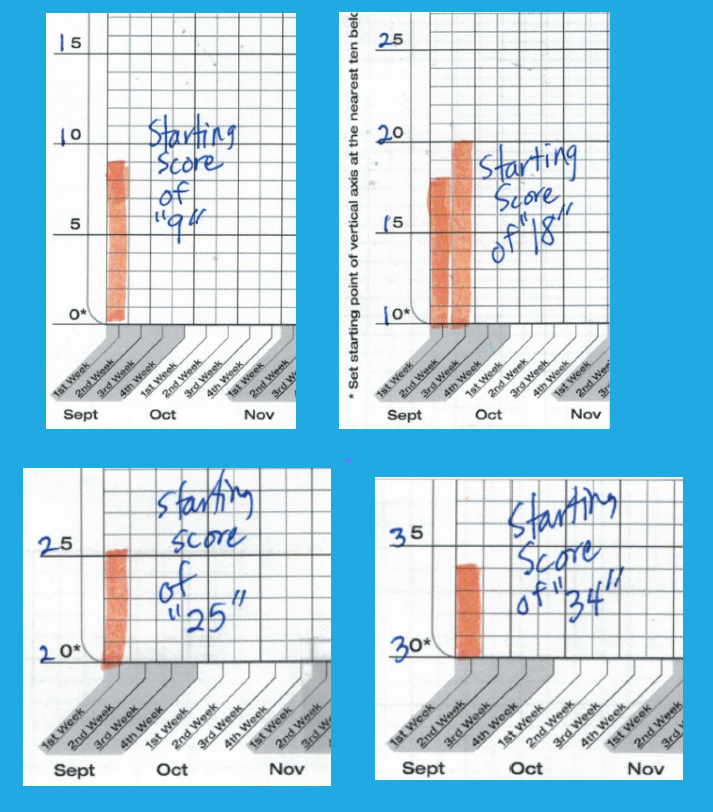
Here are four examples of how to complete the vertical axis on the Individual Student Graph.
Amy writes:
I have a question about the Individual Student graph form. Can you send me example of a completed graph? I understand marking 10 points lower but the 0…5…..0…5….0…5 axis confused me.
Dr. Don answers:
Amy,
Here are some examples of how you would fill out the vertical axis of the Individual Student Graph depending on what the student’s starting score was on the Two-Minute Timings. The form says, “Set starting point of vertical axis at the nearest ten below the student’s first 2-minute timing (e.g., if first timing is 37, begin graph at 30, etc.).”
If a picture is worth a thousand words, then these four examples should make the procedure clearer. Thanks for asking for examples–which is often the best way to explain/teach something!
If the starting score was 9, you would set the starting point of the vertical axis at zero.
If the starting score of the two-minute timing was 18, you would set the starting point of the vertical axis at ten.
If the starting score of the two-minute timing was 25 you would set the starting point of the vertical axis at twenty.
If the starting score of the two-minute timing was 34 you would set the starting point of the vertical axis at thirty.
I tried to print the student math graph but the link appears to be broken.
Question- do you have a digital version of the math graph to track data- that you can send me or I can download?